🟢 DataInterview
A/B Testing in Data Science Interviews by a Google Data Scientist | DataInterview
source: https://www.youtube.com/watch?v=DUNk4GPZ9bw
7 steps — AB Testing procedure
- Problem statement: what is the goal of the experiment?
- 1- what’s the user journey?
- 2- based on this user journey, what’s the success metric?
- when considering a metric (=proxy), review these 4 guiding principles, attributes, qualities:
- measurable: can the behaviour be tracked using the data you collect from users?
- attributable: can you assign the behaviour (effect) to the treatment (cause) → is there a reasonable linkage?
- sensitive: does the metric have (stats speaking) low variability that you can distinguish the treatment from control?
- timely: can you measure the success behaviour in a short term? (remember AB testing is fast and iterative)
- when considering a metric (=proxy), review these 4 guiding principles, attributes, qualities:
- Hypothesis testing: what result do you hypothesise from the experiment?
- what’s the null hyp and the alternative hyp?
- and other params: significance level α, statistical power β, minimum detectable effect (MDE)
- usually α = 0.05, β = 80%
- and other params: significance level α, statistical power β, minimum detectable effect (MDE)
- what’s the null hyp and the alternative hyp?
- Design the experiment: what are the experimentation parameters?
- what are the randomisation units?
- what is the targeted user type / population?
- what is the sample size?
- general formula = (assuming α = 0.05, β = 80%)
- = sample standard deviation (to be assumed, or use historical data)
- = difference of key metric between treatment vs. control
- general formula = (assuming α = 0.05, β = 80%)
- what is the duration of the experiment?
- generally 1-2 weeks
- too short: cannot capture fair “cycles” → account for day-of-the-week effect (weekday vs. weekend eg)
- too long: introduce bias, conditions are no longer stationary
- generally 1-2 weeks
- Run the experiment: what are the requirements for running an experiment?
- what’s the instrumentation that is required to collect the data?
- how to analyse the results?
- note: do not peek at the p-value, there is lots of variability in between, not good practice to conclude anything while exp is still running
- Validity checks: did the experiment run soundly without errors or bias?
- 🛑 run some sanity checks! 🛑
- remember that this step cannot be skipped because if data results are flawed (error, bias) → the interpretation of the results will be too → poor decisions
- Interpret the results: in which direction is the metric significant statistically and practically?
- stat significant: is the result stat significant, ie not due to random luck
- check: p-value
- practical significant: was there enough change for the business to benefit
- check: confidence intervals and MDE
- stat significant: is the result stat significant, ie not due to random luck
- Launch decision: based on the results + trade-offs, should the change launch?
- to decide whether to launch or not a change:
→ depends on both statistics and business. - some guidelines:
- to decide whether to launch or not a change:
| Considerations | Explanations |
|---|---|
| Metric trade-offs | Primary metric may improve BUT secondary metrics (eg guardrails) may decline |
| Cost of launching | Launching and maintaining the change across all the users might be costly (eval based on this experiment context) |
| Type I errors | Are Type I errors (False positive = detect sth, while nothing in reality) important? cause this might affect bottom line if actually no effect, but you carry on with launch |
example use case:
- Problem statement:
- “online clothing store, test new ranking algorithm to provide products more relevant to customers”
- definitions:
- context: understand the nature of this product (reframe)
- e-commerce store
- sells goods such as clothing goods (shoes, bags, clothes, merchandises etc.)
- uses product recommendation algorithm (when users search for keyword?)
- based on user profile, user transaction history, etc.
- the business goal = more revenue sales
- user journey: define the user funnel
- land/visit, browse+search, view, add to cart, checkout, pay
- and the ranking algorithm change activates at the step: SEARCH (not browse apparently here)
- obviously, the purchase = pay is the end goal and success that business wants to achieve
- success metric: what does “more relevant products to customers” look like?
- considering the 4 guiding principles for choosing a success metric,
- ✅ success metric = revenue per day per user
- ❌ a bad metric here = user time spent on the website → ambiguous linkage (ie not directly tied to that only, can be for other reasons), high variability between users
- considering the 4 guiding principles for choosing a success metric,
- context: understand the nature of this product (reframe)
- Hypothesis testing:
- clear hypothesis statements:
- null hyp H_0 = there is no change in revenue with this new algorithm
- “the average revenue/day/user between the baseline and variant ranking algorithms are the same”
- alt hyp H_a = higher/different revenue thanks to this new algorithm
- “the average revenue/day/user between the baseline and variant ranking algorithms are different”
- null hyp H_0 = there is no change in revenue with this new algorithm
- define parameters:
- significance level = alpha α = decision threshold = 0.05 (usually)
- if p-val < 0.05 : reject H_0, conclude H_a → not due to pure luck (statistically significant)
- if p-val > 0.05 : reject H_a, conclude H_0 → most likely pure luck
- statistical power = probability of detecting an effect if H_a is true = 0.80 (usually)
- MDE = minimum detectable effect = 1% (for big platforms)
- if change is > MDE = 1% → practically significant
- significance level = alpha α = decision threshold = 0.05 (usually)
- clear hypothesis statements:
- Design the experiment:
- define the experiment parameters:
- randomisation unit = user
- target population = users who search a product (based on the user journey funnel)
- “what users do you want to select and allow to participate in the experiment?” → rule 👍 = when users are exposed to the change
- sample size = formula =
- duration = 1-2 weeks
- define the experiment parameters:
- Run the experiment:
- Set up instruments and data pipelines to collect data
- instruments = platforms or tools to collect the data and track results
- Set up instruments and data pipelines to collect data
- Validity checks:
- 🛑 Time to sanity check 🛑
- why? cause faulty experiments can lead to bad decisions.
- Some sanity checks:
- Instrumentation effect: are there any bugs or glitches or anything that can potentially affect the results and introduce bias?
- External factors: is there any external disruption that needs to be taken into account, that may impact the results?
- Selection bias: is the distribution between control and treatment group randomised, fair, homogeneous?
- Sample ratio mismatch: in reality, it might not be 50-50 split (can be 49-51), so in this case, you should check that the ratio is sound with chi-square test eg ❓
- Novelty effect: users can react to new changes differently, how to detect this? → check by user segments: new visitors (they have no baseline) vs. recurrent visitors (they might see the change) ⇒ is there a significant difference?
- 🛑 Time to sanity check 🛑
| Bias | Checks |
|---|---|
| Instrumentation effect | Guardrail metrics (e.g. latency time) |
| External factors | Holidays, competition, economic disruptions (e.g. covid) |
| Selection bias | A/A Test |
| Sample ratio mismatch | Chi-square goodness of fit test |
| Novelty effect | Segment by new and old visitors |
- Interpret the results:
- Analyse the “direction of the success metric”
- ie negative? or positive?
- statistically significant?
- p-val > α = 0.05?
- confidence intervals > MDE?
- practically significant?
- relative diff > MDE?
- example of a table and metrics:
- interpretation: at significance level α = 0.05, there is statistical significance to reject H_0, and conclude that the average rev/day/user between baseline and variant experiments are different (ie conclude H_a).
- Analyse the “direction of the success metric”
| tests | metric (Rev/day/user) | abs diff | relativ diff | p-val | CI |
|---|---|---|---|---|---|
| control | 25.00$ | (goal =1%) | (goal<0.05) | ||
| treatment | 26.10$ | 1.10$ | +4.40% | 0.001 | (3.40-5.40)% |
- Launch decision:
- weigh pros and cons, evaluate trade-offs between statistics results and business context/factors, go over the main considerations:
- Metric trade-offs (primary vs. secondary)
- Cost of launch
- Possible type I error (false positives)
- here’s an example
- (1) ENTIRE CI bounds = negative
- 🛑 ccl: change the algorithm, or abort idea
- (2) lift = positive, but < practical significance AND CI bounds < practical significance
- 🛑 ccl: change the algorithm, or abort idea
- (3) lift = positive, the CI long and stretches above practical significance ⇒ there is likelihood that you might see a lift with practical significance
- 🔄 ccl: rerun experiment with increased power (β > 80%) ⇒ improve precision of the lift
- (4) lift > practical significance BUT lower CI < practical significance BUT still positive!
- 🔄 ccl: rerun experiment with increased power (β > 80%) ⇒ improve precision of the lift
- (5) both lift AND CI bounds > practical significance
- ✅ ccl: strong support to launch decision
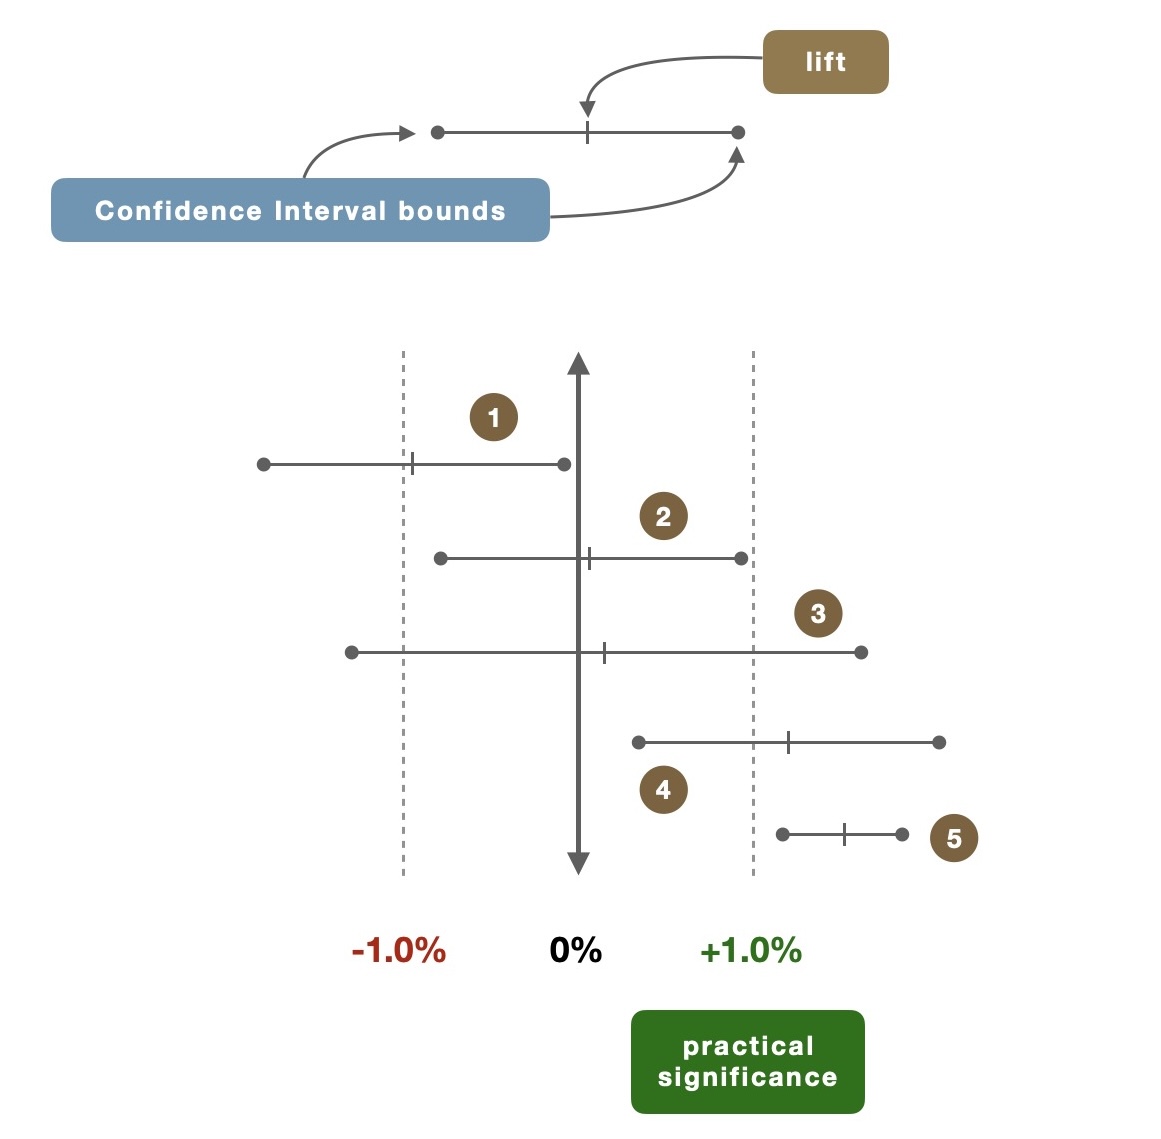
- ✅ ccl: strong support to launch decision
- (1) ENTIRE CI bounds = negative
- weigh pros and cons, evaluate trade-offs between statistics results and business context/factors, go over the main considerations:
🟢 Emma Ding (part 1)
A/B Testing Fundamentals: What Every Data Scientist Needs to Know!
source: https://www.youtube.com/watch?v=VpTlNRUcIDo
what is it?
- A/B test = controlled experiments, split tests
- experiment where all elements are constant except for 1 (or more) variables
- compare control group against experiment group
what can be tested?
- can be as simple as a button colour, a font → stylistic
- or something more complicated like a back-end algorithm → recommended/personalised content eg
why do we run these experiments?
- to make data-driven decisions ⇒ reliable and repeatable
- to control + to be confident in causality effect too → when things are tested and validated in isolation, the causality is more reliable
what are the major steps to run A/B tests:
- experiment prerequisites
- define objective and key metrics
- how to measure the goal of the test = “overall evaluation criterion (OEC)”
- eg test = change button colour and OEC metric = revenue per user per month (the more concrete, the better)
- and the MDE = minimum detectable effect (kind of the goal to validate the change, in terms of the OEC)
- choose experiment variants (change) that are easy to conduct implement
- eg dont aim to redesign a whole website layout, but rather aim to test small isolated changes gradually
- make sure to have enough “randomisation units” = basically users (experiment is done at the user level)
- how much is enough?
- thousands is a good rule of thumb
- the larger the number → the smaller the effect that can be detected (ie you more likely to detect small effects in bigger sample size vs. just 10 sample)
- also there are formulas to follow to compute this (eg Sample size per variation, with power and significance)
- how much is enough?
- define objective and key metrics
- experiment design
- what user population? all users vs. specific user population?
- eg a feature that is only available for users in a particular geographic region
- how to determine?
- consider user journey, change variant characteristics, etc.
- what sample size?
- statistical power # sample size
- to detect a small change, we need more users
- users are randomly allocated to each group
- also there are formulas to follow to compute this (eg Sample size per variation)
- test duration, how long to run the test?
- to determine the duration, take into account: seasonality, day of week, primacy and novelty effects
- rule of thumb < 2-4 weeks (otherwise, time is no longer stationary)
- what user population? all users vs. specific user population?
- running experiment
- collect data
- basically the metrics you want to track
- collect data
- result → decision
- check and interpret results to make a decision
- step 1: sanity checks to make sure the data is reliable
- step 2: if reliable, take a look at the metrics you’re tracking, make tradeoffs (some might increase while other decrease, it won’t be perfect)
- step 3: consider the cost of launching the change (implementation, maintenance, complexity, limitations)
- step 4: consider the benefits of launching the change, does it outweigh the costs?
- check and interpret results to make a decision
- post-launch monitoring
- monitoring is crucial
- because short-term effect can be different from the long-term effect
- monitoring is crucial
🟢 Emma Ding (part 2)
A/B Testing Made Easy: Real-Life Example and Step-by-Step Walkthrough for Data Scientists!
source: https://www.youtube.com/watch?v=VuKIN9S8Ivs
here’s an example
what is tested?
- hypothesis: “if similar products are showed at checkout step, then it can generate more revenue”
- concerns:
- may decrease revenue if similar products are cheaper, more appealing etc.
- may distract the customers
- may delay or abandon checkout altogether
- may decrease revenue if similar products are cheaper, more appealing etc.
- experiment prerequisites
- clear objective & key metrics
- objective = more revenue
- MDE = 2€ / user
- key metric = revenue per user (ie it’s normalised, which is better in case the number of users is slightly different for each group)
- objective = more revenue
- what’s the variants
- control group = no change = just checkout, without additional similar product suggestions
- variant group = checkout + similar products suggestion (assuming the recommended products are in fact similar)
- variant group 2 = checkout + popup window with similar products suggestion (same recommended algorithm here)
- enough randomisation units
- … we assume the number of users is enough for each group
- clear objective & key metrics
- experiment design
- targeted user population
- how to determine?
- let’s observe user journey: can be seen as a funnel, top level = land on homepage → browse products → add products to cart → start checkout → finish checkout → revenue (users can go back and forth between steps “start checkout” and “browse products”)
- with this user journey, not the best idea to target all users from step 1 - land on homepage, cause they won’t see the feature anyway
- best choice for targeted users = users that start checkout
- how to determine?
- what sample size?
- how many users should be randomly allocated to each group? what to consider?
- practical significance boundary → eg if the benefits >> costs, very much depends on use cases
- here, eg, if revenue increase = 2€ / user = MDE → this would mean benefits >>> costs, thus we can decide to launch the change to production
- sample size = with = std population (to be assumed, or use historical data) and = difference between treatment & control (here 2€ eg)
- practical significance boundary → eg if the benefits >> costs, very much depends on use cases
- how many users should be randomly allocated to each group? what to consider?
- how long to run the test?
- first, make sure to have a ramp-up plan: make sure no bugs, traffic can be handled, expose to a small population then gradually increase percentage
- eg day 1 → 5% users, day 2 → 10 %, day 3 → 33%, day 4 → 33% etc. until this makes up the sample size you defined (or even more as it’s recommended to be overpowered rather than underpowered)
- careful! might want to make the users are unique, and not coming back on the different days
- consider day of week effect
- eg people usually shop more during weekends → good idea to run the tests for more than a week then
- consider seasonality
- eg if you run your experiment during black friday → might not be representative for normal days / behaviours
- consider primacy and novelty effect
- users respond to changes differently (some like it, some don’t)
- sometimes, time is needed to adapt to changes ⇒ might be a good idea to run the experiment for longer until behaviours stabilise
- but also, define a clear stop data because running the test for too long, won’t yield any useful information anymore
- first, make sure to have a ramp-up plan: make sure no bugs, traffic can be handled, expose to a small population then gradually increase percentage
- targeted user population
- running experiment + collect data
- result → decision
- check and interpret results to make a decision
- step 1: sanity checks to make sure the data is reliable
- check number of users in each group
- check latency when loading the page (this might have been a distraction) for all groups! ⇒ user experience is consistent among all groups
- step 2: if reliable, take a look at the metrics you’re tracking, make tradeoffs (some might increase while other decrease, it won’t be perfect)
- step 3: consider the cost of launching the change (implementation, maintenance, complexity, limitations)
- step 4: consider the benefits of launching the change, does it outweigh the costs?
- recommended to launch a change when both criteria are checked:
- statistically significant = is the effect real or just noise (p-value < 0.05)
- practically significant = is the effect big enough to matter to the business (key metric goal is met, eg here revenue = +2€ / user, AND confidence level is also HIGH enough for lower bounds to make sure this is enough)
- recommended to launch a change when both criteria are checked:
- step 1: sanity checks to make sure the data is reliable
- check and interpret results to make a decision
- post-launch monitoring
- monitoring is crucial
- because short-term effect can be different from the long-term effect
- monitoring is crucial
🟢 Exponent
How To A/B Test a Product
source: https://www.youtube.com/watch?v=jEpwNaHjD68
what is it?
- scientific test for tech companies to make decisions that impact user behaviours
- → it helps validate product decisions
examples:
- what experiments would you run to incentive user to post more on ig?
5 steps to answer this question:
- hypotheses
- what are the hypotheses?
- what do you want to test?
- “if we make change X, then it will impact Y”
- eg: “if we remove likes number, then maybe users will post more photos”
- methodology
- how to run this experiment?
- what are the targeted users? all users? specific user segment?
- = experiments are run with 2 cohorts of similar users
- group 1 = control group = no change
- group 2 = experiment / test group = implemented change
- metrics
- what metrics are measured?
- ie what metrics are going to convey useful insights
- eg here, obviously the number of photos posted
- but also other metrics: bounce rate of sharing a photo, click-through rates of other buttons
- and something important, a guardrail metric: to make sure things are still ok, eg time spent on the feed doesn’t decrease too much → users still use the app normally, and this doesn’t impact things too negatively
- what metrics are measured?
- trade-offs
- every experiment has trade offs
- what are some potential pitfalls to the proposed feature that may not be evident through data alone?
- eg, maybe users will feel more lonely since they don’t know how community engages with them or not
- ⇒ user delight, loneliness are qualities that cannot be captured easily with metrics
- some information can be missed or neglected in a quantitative-focused mindset / experiment
- impact
- now that you have the results, the information, how to translate them into something useful?
🟢 Data Science Dojo
What is A/B Testing? | Data Science in Minutes
source: https://www.youtube.com/watch?v=zFMgpxG-chM
what is it?
- a statistical way of comparing two or more versions
- understand which version performs better
- is the difference even statistically significant
why is it important?
- data-driven approach >>> opinions, intuitions, beliefs
what’s the steps?
- define success criteria
- hypothesis : “if X changes, then Y might happen”
- eg, conversion rate improves, newsletter sign-up increase, etc.
- hypothesis : “if X changes, then Y might happen”
- methodology + sample size
- the split doesn’t have to be 50-50, but it is essential to define what’s the minimum number of ppl you need to run the test (🤔 note: skeptical of the sample size difference statement)
- if there are multiple things you’re testing at once = multivariate test
- what factors can be tested
- colors, size, font, positions, layout, content (text, image), feature, …
other
other resources: